Power BI
Interactive Sales Report
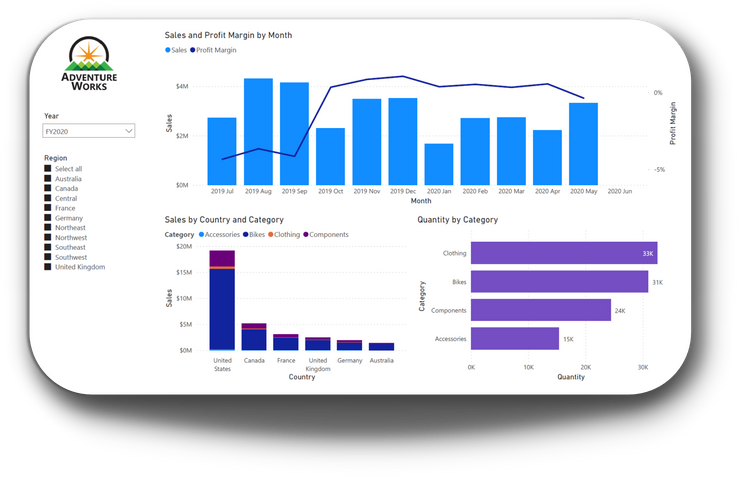
Visualize Sales and Profit margin by year-month, Sales by country and category, Quantity by category. Filter by year and region.
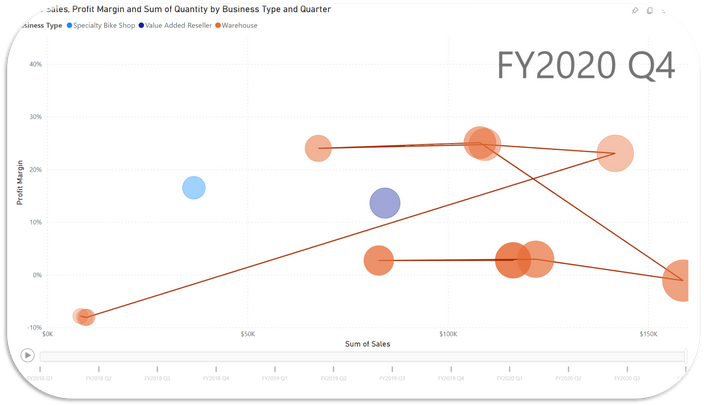
Animated Scatter Chart
The evolution of different category sales and profit margin for 2 different retailers and a warehouse over time.
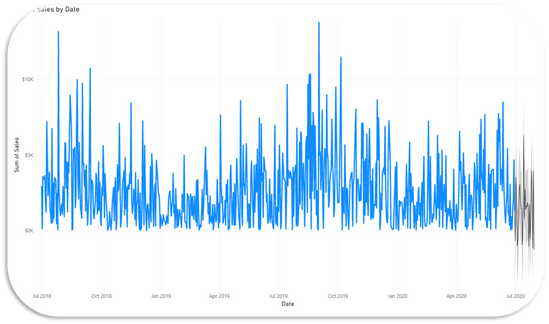
Forecast
Create a forecast generated by Power BI's advanced analytical AI techniques to determine possible future sales revenue.
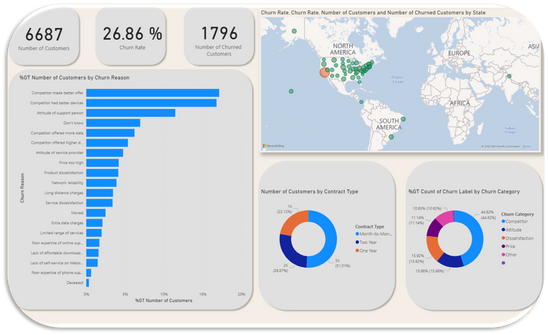
Customer Churn Overview
The topmost selected reasons, representing the 45.40% of churn reasons, were because the competitor made a better offer, had better devices, or because of customer service/support’s attitude.
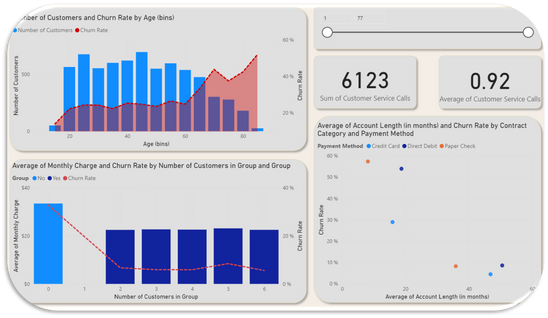
Churn by Age, Group, and Account length
Analyzing customers by age, family/group plan, and payment type.
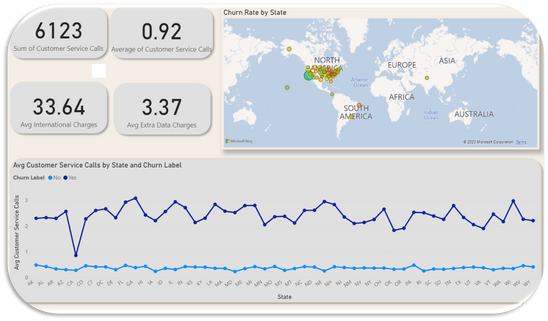
Customer Service Calls Insights
Analyzing customer service calls per State
Contact
Data-Driven insights for actionable results. Let's connect to drive meaningful change!
San Salvador, El Salvador
-- Remote since 2020 --
+503 78197387

